This video shows Calgary's skyline being gradually built over an extended time span from 1892 onwards. Only buildings that currently exist are shown. The color styling can represent any building or market variable from the Cube Cities database.
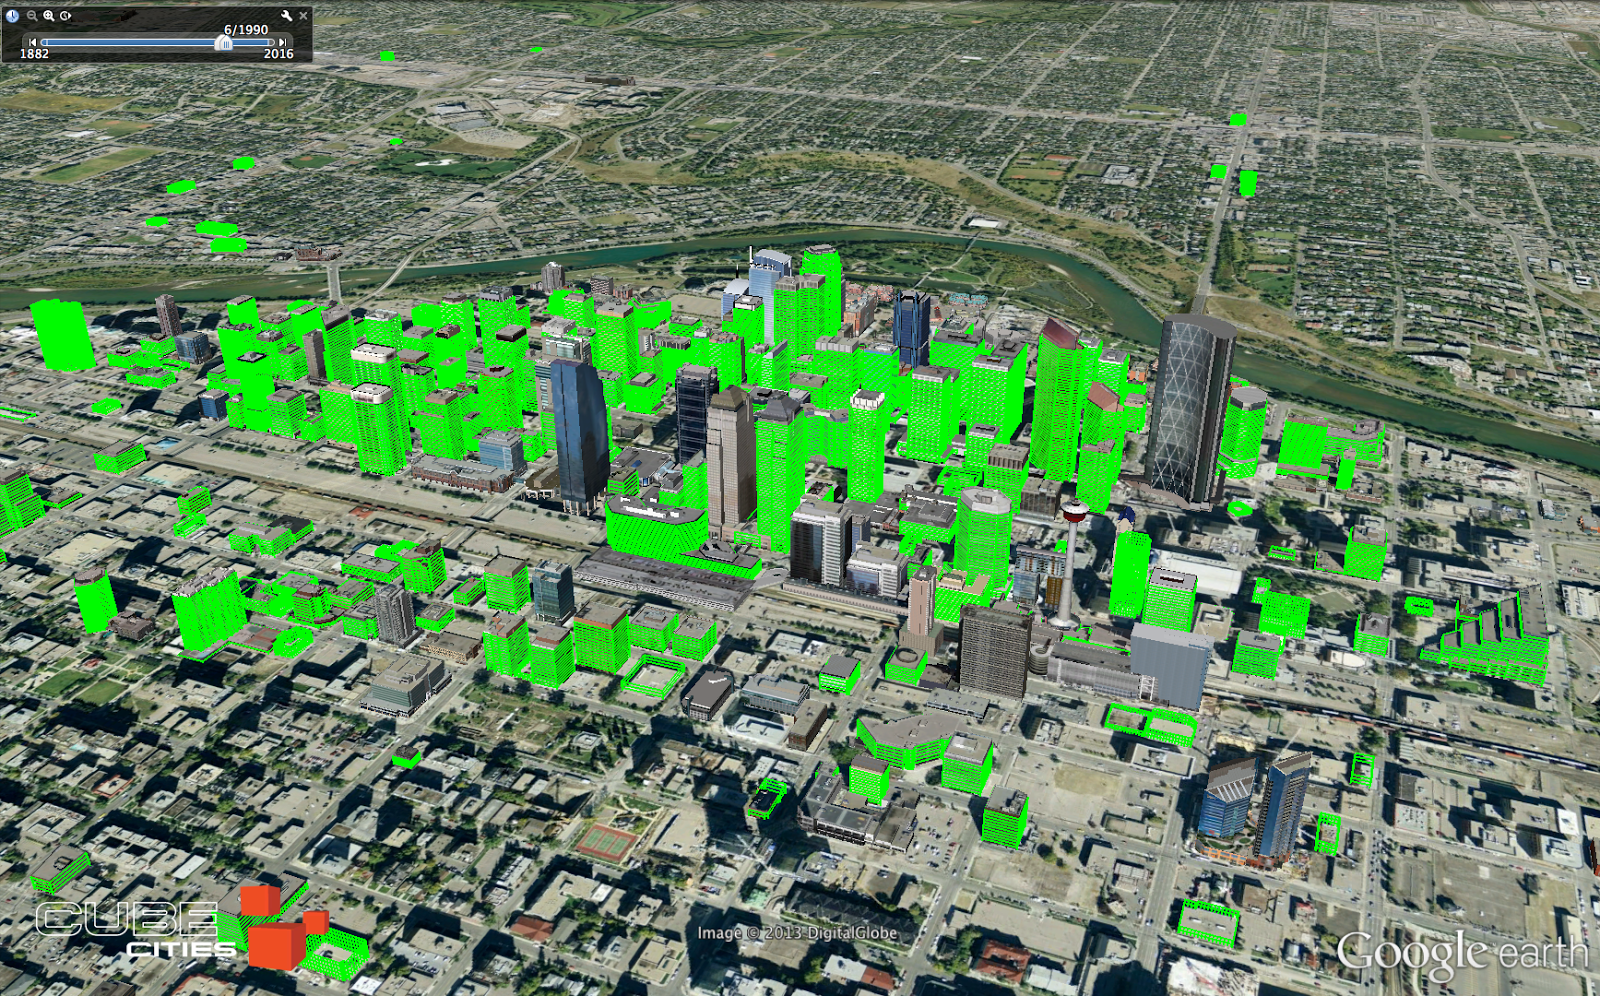
Another way to learn about a cities development pattern is to use a series of time-lapsed visualizations, highlighting existing buildings, built by year indicated. This provides a better idea of the age of a cities current building inventory. The graphics below tell the story of the construction boom in Calgary from the mid-1970s to the early 1980s. Its easy to recognize that the vast majority of all buildings downtown Calgary were built after 1970.
Green indicates buildings built by the year indicated.
1950
1955
1960
1965
1970
1975
1980
1985
1990
Cube Cities produces these visualizations for any major city in North America. Contact us to see visualizations of other markets.
Interesting, I was looking for the Robin Hood mill and going back to the notes I can see it only includes currently existing buildings. Would love to see a historical version with all buildings, including those that also came down once up.


Interesting, I was looking for the Robin Hood mill and going back to the notes I can see it only includes currently existing buildings. Would love to see a historical version with all buildings, including those that also came down once up.
ReplyDelete